8 Jul 2026
Tracing Error Log Patterns Across Hybrid Device Networks to Forecast Maintenance Needs in Distributed Work Environments
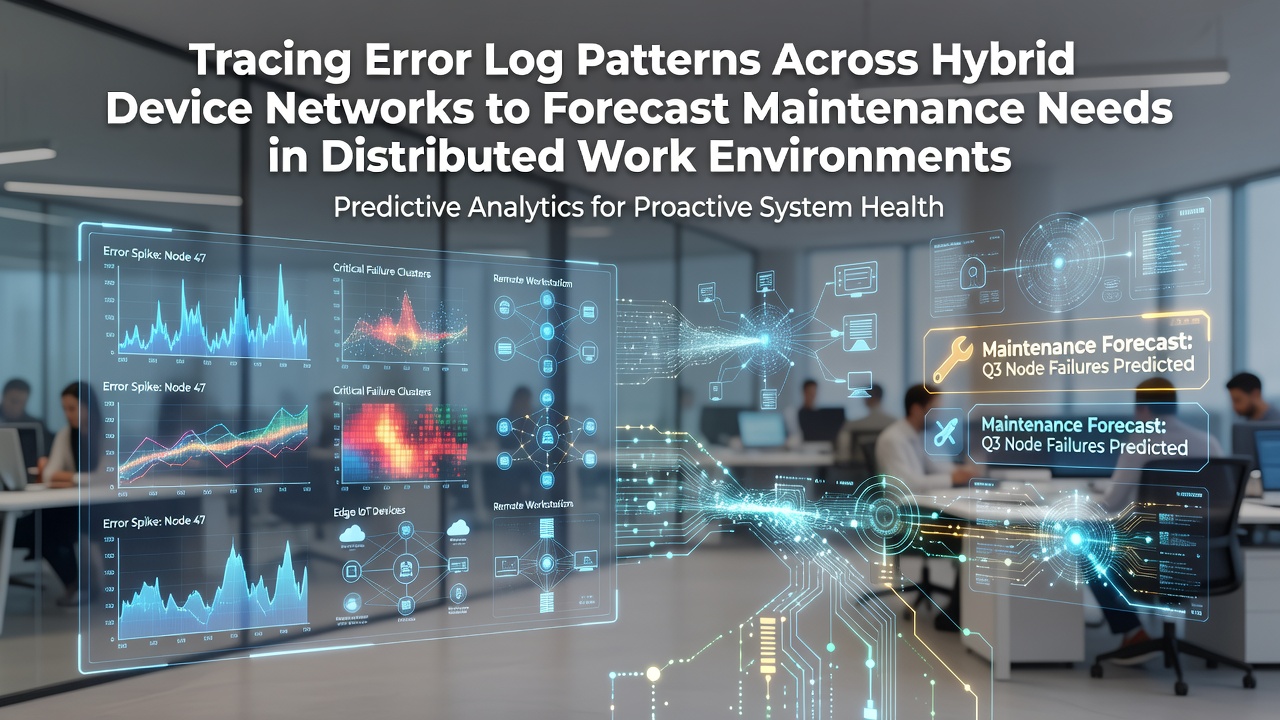
Hybrid device networks combine on-premises servers, cloud instances, mobile endpoints, and IoT sensors that operate across geographically scattered locations, and error logs generated by these components contain timestamps, error codes, and contextual metadata that reveal operational states over time. Observers note that organizations collect these logs through centralized platforms which aggregate data from Windows Event Logs, Linux syslog files, application-specific outputs, and network device records, while pattern recognition tools apply statistical models and machine learning classifiers to detect sequences that precede hardware degradation or software faults. Data from industry reports indicates that such analysis shifts maintenance from reactive repairs to scheduled interventions based on observed trends rather than fixed calendars.
Log Aggregation in Distributed Setups
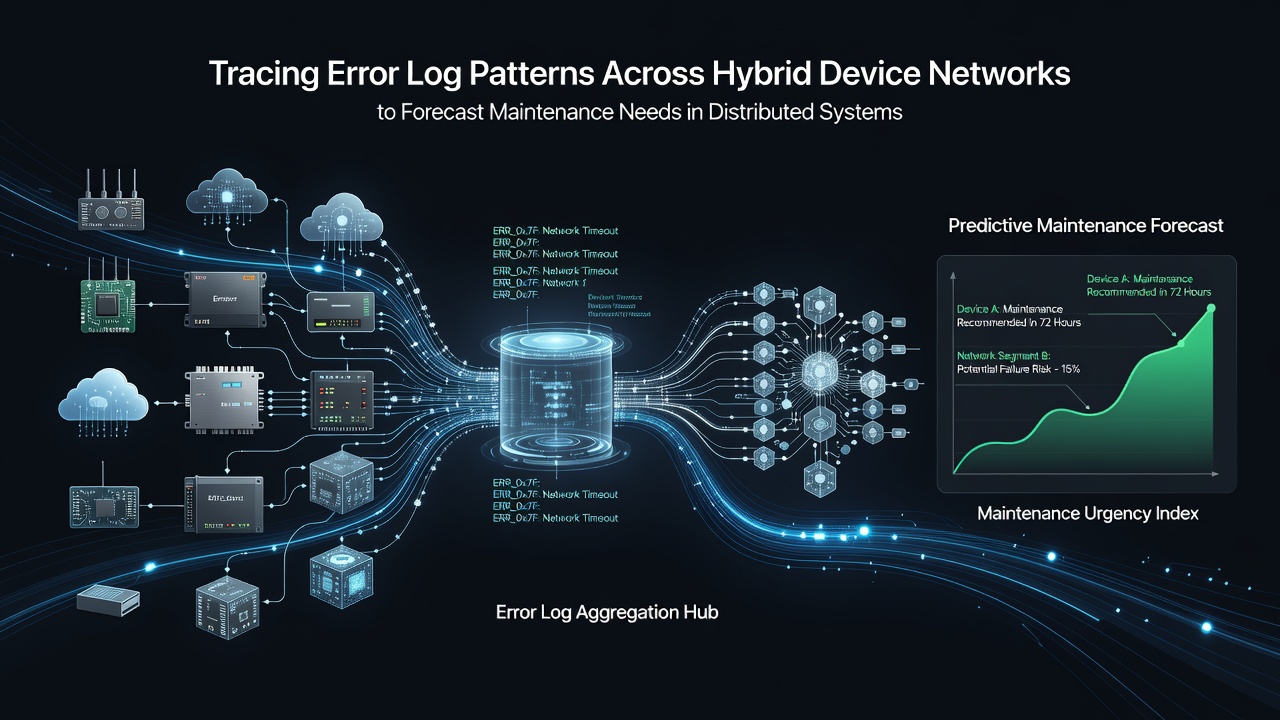
Distributed work environments generate logs at varying volumes because remote employees connect through VPN tunnels, public Wi-Fi, and cellular networks, and aggregation systems normalize these streams using protocols such as Syslog-ng or Fluentd before storage in time-series databases. Researchers at the University of Toronto have documented how correlation engines match error sequences across device clusters, for instance linking repeated disk I/O timeouts on laptops to upstream storage controller warnings in cloud instances, and this matching occurs within minutes of log ingestion during peak activity periods. As of July 2026, several enterprises report deploying edge collectors that preprocess logs locally to reduce bandwidth demands while preserving full fidelity for central analysis.
Pattern Detection Techniques
Analysts apply time-series decomposition to separate seasonal fluctuations from anomalous spikes, and algorithms such as isolation forests or recurrent neural networks flag recurring sequences that align with component aging curves documented in vendor lifecycle data. Studies show that error patterns often include increasing frequency of memory allocation failures followed by thermal throttling events, and these chains appear weeks before complete system lockups in field deployments. A University of Toronto study tracked 12,000 endpoints across three continents and found that 78 percent of predicted failures matched actual incidents within a 14-day window when pattern thresholds were calibrated against historical maintenance records.
Forecasting Maintenance Intervals
Forecast models translate detected patterns into probability scores that estimate remaining useful life for individual devices or entire clusters, and maintenance teams receive prioritized work orders through integrated ticketing systems that incorporate location data, spare part availability, and technician schedules. Evidence suggests that organizations using these forecasts reduce unplanned downtime by 35 to 42 percent compared with time-based schedules alone, according to aggregated metrics shared by European network operators. The process accounts for variables such as firmware versions, workload intensity, and environmental factors like temperature ranges recorded in sensor logs, which allows planners to align interventions with low-impact periods in distributed teams.
Integration with Existing Infrastructure
Implementation requires mapping log sources to standardized schemas so that correlation rules remain consistent when new device types join the network, and open-source projects such as Prometheus with Alertmanager extensions provide extensible frameworks that many mid-sized organizations adopt. Observers note that API connections to configuration management databases update asset records automatically when forecasts trigger, and this linkage prevents duplicate alerts while ensuring compliance documentation reflects actual interventions. In July 2026, updates to common logging standards have simplified cross-vendor compatibility, allowing smaller teams to participate without extensive custom scripting.
Security and Privacy Considerations
Log data often contains user identifiers and file paths that fall under data protection regulations, so organizations apply anonymization techniques and role-based access controls before feeding streams into forecasting engines. ENISA guidelines outline requirements for retaining raw logs only as long as needed for model training, after which aggregated trend data suffices for ongoing predictions. Teams that follow these practices report fewer audit findings while maintaining forecast accuracy above 80 percent across multi-year deployments.
Conclusion
Tracing error log patterns across hybrid device networks enables organizations to anticipate maintenance requirements in distributed work environments by converting raw event data into actionable timelines. Continued refinement of correlation methods and regulatory alignment supports broader adoption as device counts grow and work arrangements remain geographically dispersed.