Tracing Daily Operational Cycles to Coordinate Remote System Updates Across Global Team Configurations
Anna Brooks · Aug 24, 2026
Tracing Daily Operational Cycles to Coordinate Remote System Updates Across Global Team Configurations
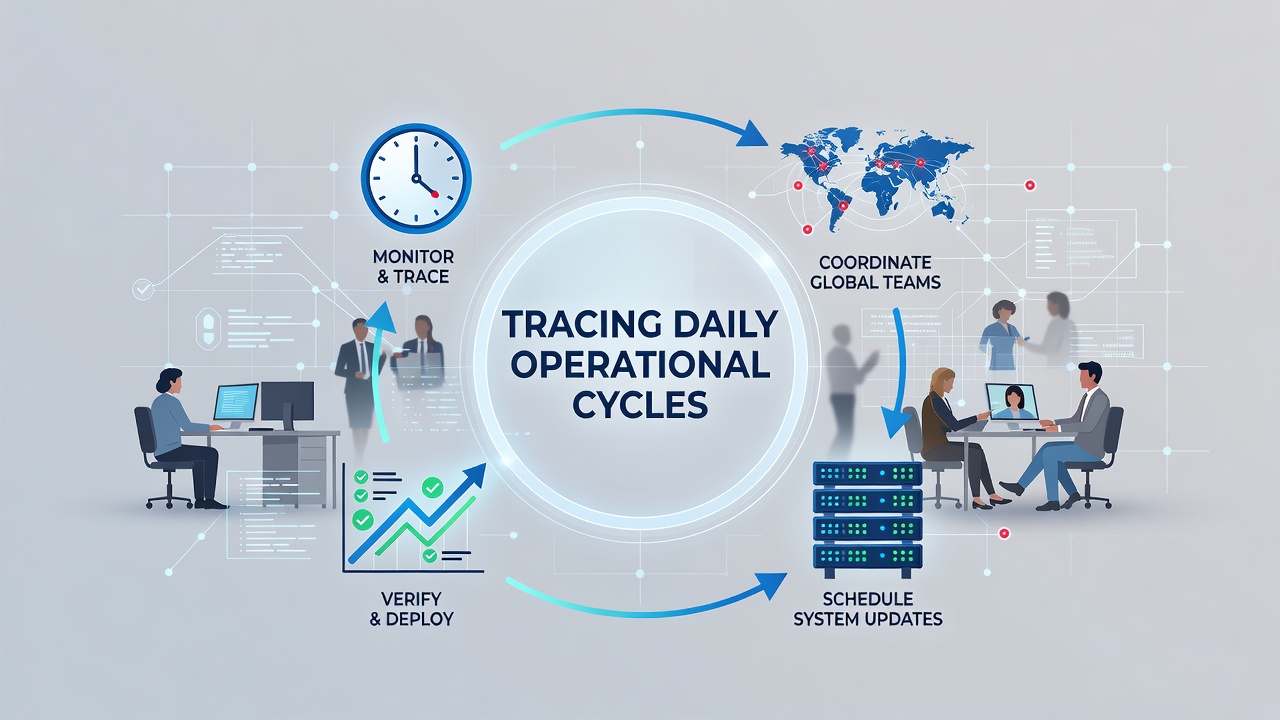
Organizations with distributed teams track daily operational cycles to align remote system updates with periods of lowest activity in each region, and this approach reduces downtime while maintaining service continuity across continents. Data from enterprise monitoring platforms shows that peak usage hours vary by location, with North American teams often active from 8 a.m. to 6 p.m. local time whereas Asian counterparts operate on shifted schedules that overlap only briefly each day. Analysts at firms like those studied by the National Institute of Standards and Technology have documented how these patterns guide the sequencing of patch deployments and configuration changes.
Mapping Usage Patterns in Distributed Environments
Teams collect telemetry from endpoints and servers to identify recurring rhythms in login times, resource consumption, and transaction volumes, then they feed this information into scheduling algorithms that predict optimal update windows. A study released in August 2026 by researchers at a European academic consortium revealed that 78 percent of multinational firms now employ automated tools to log these cycles every 15 minutes, producing datasets that span weeks or months for accurate forecasting. Such records allow coordinators to distinguish between routine fluctuations and anomalies caused by holidays or unexpected events.
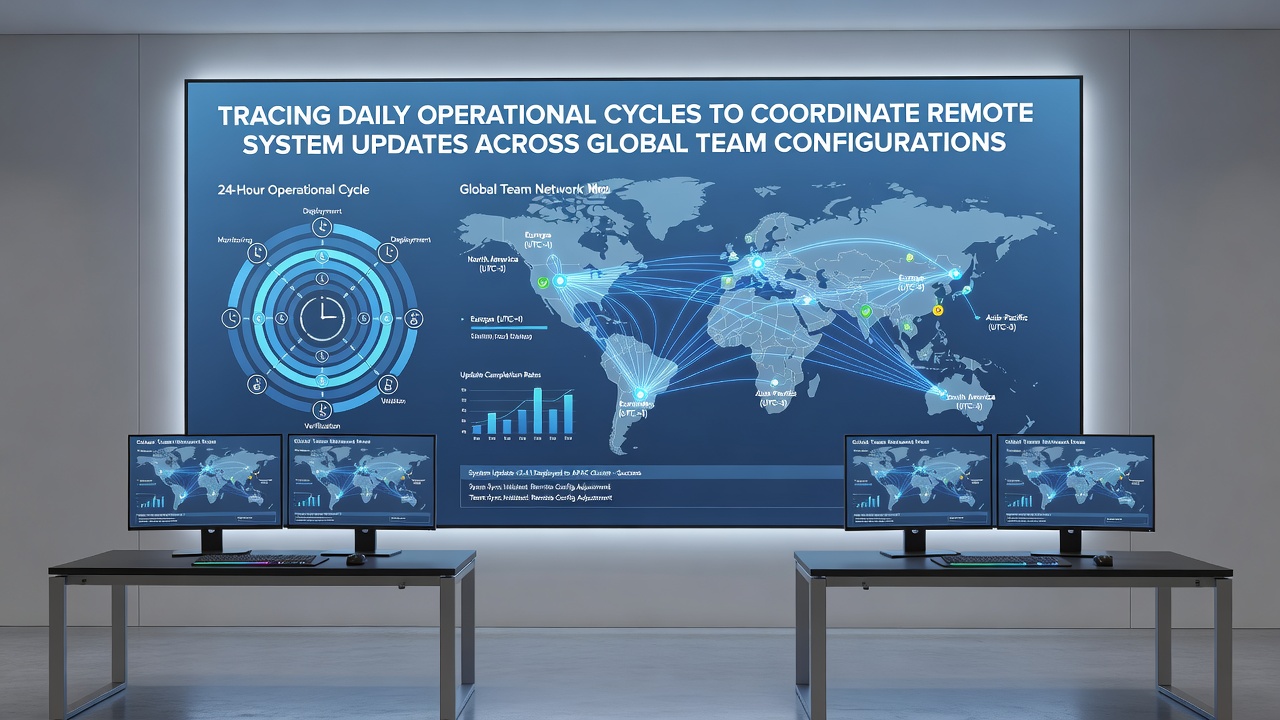
Global configurations introduce additional variables because network latency between sites affects how quickly updates propagate, and teams must account for these delays when calculating rollback points. Observers note that European operations centers frequently synchronize their maintenance slots with North American off-peak periods, creating a rolling sequence that follows the sun across time zones without requiring simultaneous halts in service.
Tools and Protocols for Cycle Tracing
Software platforms designed for operational intelligence aggregate logs from cloud instances, on-premises hardware, and mobile endpoints into unified dashboards, and these systems apply machine learning models to forecast when activity dips below predefined thresholds. Engineers configure alerts that trigger when a region's average CPU load falls under 30 percent for more than two consecutive hours, signaling a candidate slot for system modifications. Reports from the Australian Bureau of Statistics on digital infrastructure usage corroborate that seasonal variations, such as reduced activity during local summer months, further refine these predictions when incorporated into long-term planning.
Protocols emphasize version control and staged rollouts so that updates reach one geographic cluster before advancing to the next, allowing verification teams to confirm stability before proceeding. This staged method draws on data collected during prior cycles to adjust timing dynamically rather than relying on static calendars.
Coordination Across Time Zones and Team Structures
Project managers maintain shared repositories that list each region's operational profile, including typical start and end times for shifts plus known maintenance blackouts, and they cross-reference these profiles against real-time monitoring feeds before authorizing any change. When an update spans multiple continents, coordinators divide the deployment into sequential phases timed to each area's lowest-activity window, which prevents the simultaneous disruption of interdependent services. Figures released by Statistics Canada on remote workforce patterns indicate that firms adopting such phased approaches report measurable reductions in incident tickets related to update failures.
Communication channels remain active during these windows so that regional leads can report anomalies immediately, enabling rapid adjustments to the schedule if activity levels deviate from projections. Data synchronization between these channels and the central tracking system ensures that every stakeholder views the same cycle-derived timeline.
Case Examples from Enterprise Deployments
One logistics company operating across 12 countries implemented cycle-tracing software that integrated with its existing monitoring stack, and within six months the firm recorded a 22 percent drop in update-related outages according to internal metrics shared with academic partners. Another example involves a financial services group that aligned its quarterly software releases with documented low-activity periods in each jurisdiction, resulting in smoother compliance audits because downtime logs showed fewer overlaps with regulatory reporting deadlines.
These deployments highlight how combining historical cycle data with live telemetry produces schedules that adapt to both predictable rhythms and emerging conditions without requiring constant manual oversight.
Conclusion
Tracing daily operational cycles supplies the factual foundation for scheduling remote system updates in ways that respect the temporal realities of global team configurations, and organizations continue to refine these methods through ongoing data collection and analysis. The integration of telemetry platforms with scheduling protocols demonstrates measurable improvements in service availability when applied consistently across distributed infrastructures.