29 Jun 2026
Mapping Query Resolution Timelines to Platform Transition Success Rates in Distributed Tech Environments
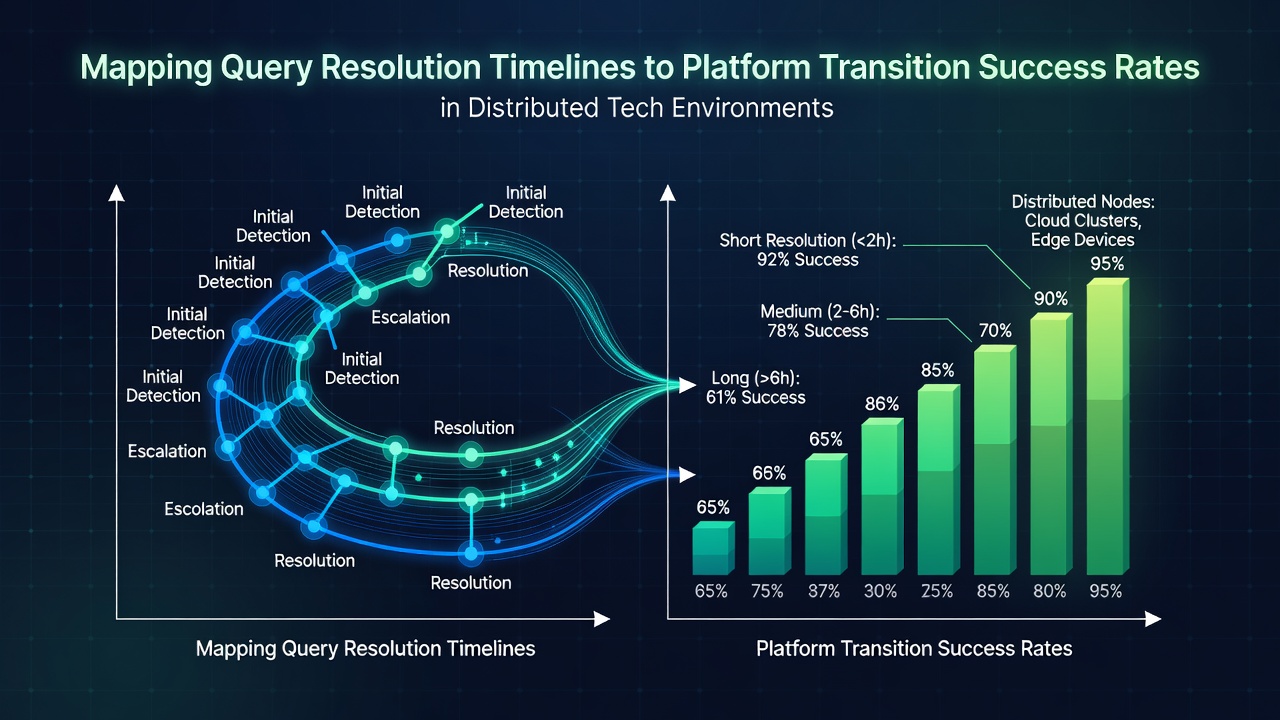
Distributed tech environments rely on coordinated data flows across multiple nodes, servers, and regions, where query resolution timelines directly influence how smoothly organizations complete platform transitions. Researchers track these timelines as measurable intervals from issue identification to full resolution, while success rates reflect completed migrations without extended downtime or data loss. Data collected from enterprise networks shows that shorter resolution periods often align with higher transition completion percentages, particularly when systems operate across geographically dispersed sites.
Key Factors in Query Resolution Timelines
Query resolution begins when end users or automated monitoring tools flag inconsistencies in system performance, and it extends through diagnosis, patching, and verification stages. In distributed setups, network latency between locations adds layers to this process, as teams must synchronize fixes across clusters. Studies from academic institutions indicate that average resolution times range from four to twelve hours for standard hardware queries, yet complex software conflicts in multi-provider clouds stretch those figures to several days. Observers note that teams using centralized dashboards reduce these intervals by routing queries to the nearest available specialist, which maintains momentum during ongoing platform shifts.
Platform Transition Success Rates and Their Measurement
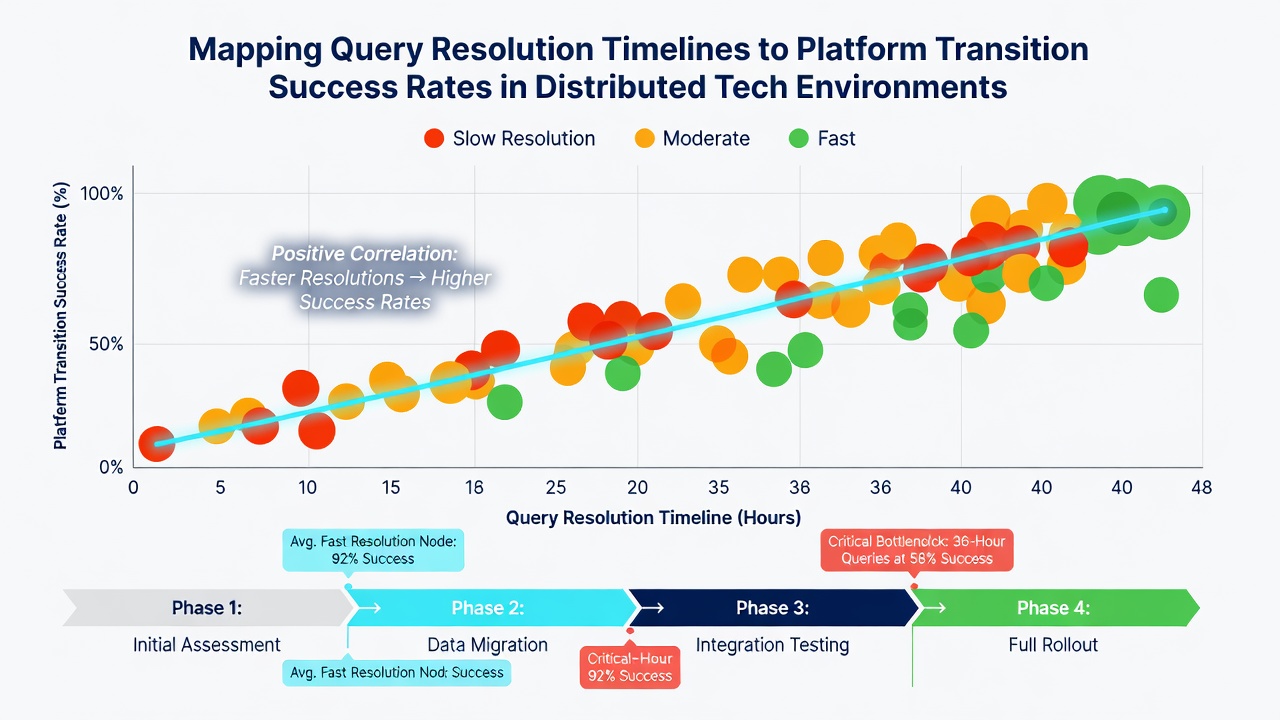
Platform transitions involve moving workloads, applications, and user access controls from legacy systems to updated architectures, often while maintaining continuous operations. Success rates are calculated as the percentage of transitions finished within projected schedules and budgets, with failure defined by rollback events or extended outages. Figures from industry reports reveal that environments with sub-six-hour average query resolutions achieve completion rates above 85 percent, whereas those exceeding twenty-four hours drop below 60 percent. These patterns hold across sectors that manage hybrid infrastructures spanning on-premises hardware and remote cloud instances.
Correlation Patterns Identified in Recent Analyses
Analysts map query timelines against transition milestones by logging timestamps at each stage of both processes, then applying statistical models to identify relationships. One dataset compiled in early 2026 demonstrated a strong inverse correlation: each additional hour added to average resolution time corresponded to a 3 to 5 percent decline in overall success probability. This relationship strengthened in June 2026 when several organizations reported accelerated transitions after implementing automated ticketing systems that prioritized queries tied to migration tasks. The same analyses highlighted that distributed teams coordinating across time zones benefited most, because overlapping resolution windows prevented bottlenecks from cascading into later project phases.
Regional Data Sources and Supporting Evidence
Information compiled by the National Institute of Standards and Technology outlines standardized metrics for tracking these timelines in large-scale environments, emphasizing the value of consistent logging protocols. Parallel findings from the Commonwealth Scientific and Industrial Research Organisation in Australia reinforce that geographic distribution amplifies the impact of delays, with Asia-Pacific networks showing steeper success rate drops when resolution stretched beyond local business hours. Both sources stress that integration of monitoring tools at the network edge helps surface issues earlier, allowing teams to address them before they intersect with scheduled transition windows.
Operational Practices That Influence Outcomes
Organizations achieve tighter alignment between resolution speed and transition success by establishing dedicated response tiers for migration-related queries. These tiers route hardware calibration issues or permission conflicts directly to engineers already embedded in the transition project, which shortens handoff times. Data synchronization methods play a supporting role, as real-time updates between sites prevent duplicate queries from forming. Teams that conduct regular firmware sequencing checks alongside query reviews maintain steadier progress, because unresolved device mismatches rarely surface during later validation stages. In distributed settings where satellite connections introduce variability, seasonal activity patterns also factor into planning, with higher query volumes during peak usage months requiring preemptive staffing adjustments.
June 2026 Developments in Tracking Methods
By June 2026, several distributed technology providers had adopted machine learning models that predict resolution timelines based on historical query patterns and current network load. These models feed directly into transition dashboards, flagging potential delays before they affect milestone dates. Early adoption data shows modest gains in success rates among organizations that combined these predictive tools with existing permission cascade monitoring, particularly in environments handling layered access controls across device clusters. The approach builds on earlier diagnostic data flow mapping techniques, extending them to cover the full lifecycle of platform changes rather than isolated troubleshooting events.
Conclusion
Mapping query resolution timelines against platform transition success rates provides organizations with concrete benchmarks for improving distributed tech operations. Evidence from multiple regions confirms that reductions in average resolution intervals correspond to measurable increases in completed migrations, especially when supported by synchronized monitoring and tiered response structures. Continued refinement of these mappings, informed by updated datasets through mid-2026, offers a pathway for maintaining performance consistency as environments grow more complex and geographically spread.