15 Jul 2026
Charting Compatibility Thresholds for Legacy Components in Modern Virtualization Layers
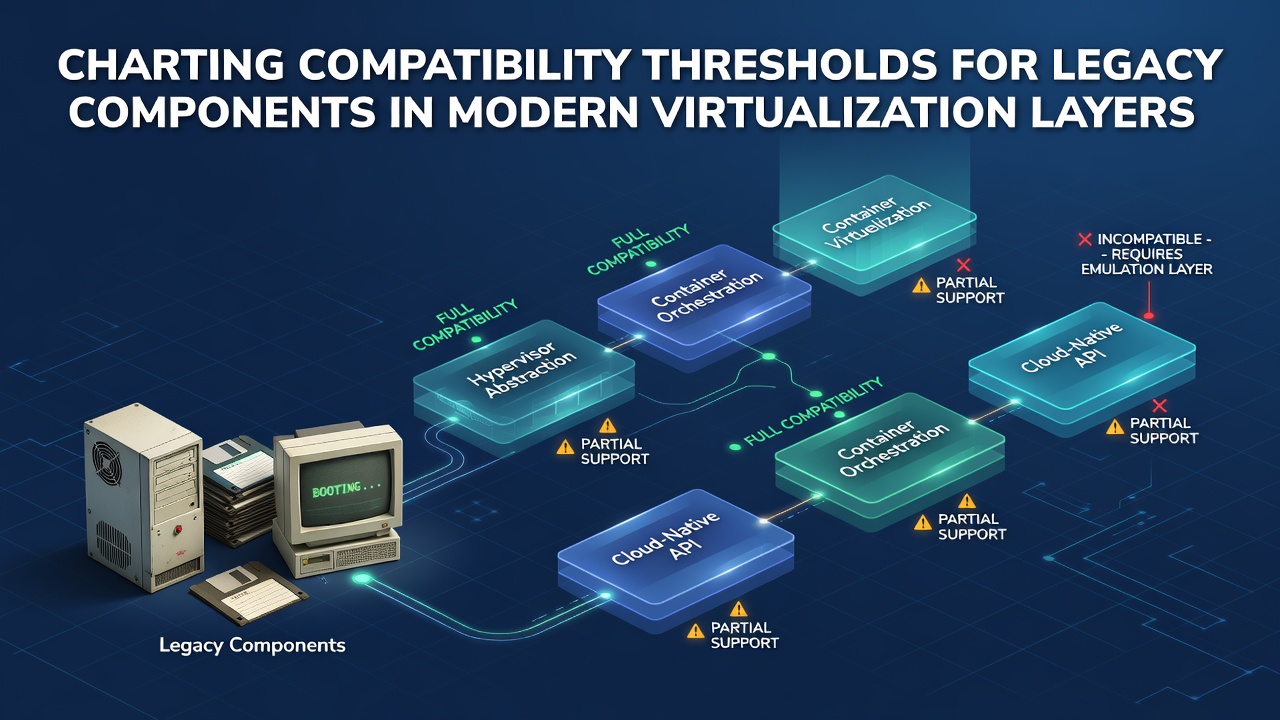
Organizations continue to integrate older hardware and software into contemporary virtualization platforms where thresholds define the precise boundaries of functional operation before performance degrades or systems fail entirely, and data from industry reports shows that enterprises managing mixed environments often track these limits through systematic testing protocols that measure CPU emulation accuracy, memory allocation stability, and driver interoperability under sustained loads.
Defining Thresholds in Virtualization Contexts
Compatibility thresholds represent measurable points at which legacy components cease reliable interaction with hypervisors such as KVM or Xen while newer layers handle resource abstraction differently, and researchers at technical institutes have documented how these points emerge from variables including BIOS emulation gaps and interrupt handling differences that surface during extended runtime simulations. Teams chart these thresholds by running controlled migrations that increment virtual CPU counts and storage IOPS until error rates spike beyond acceptable baselines, which creates datasets useful for predicting failure windows in production deployments.
Testing Frameworks and Data Collection Methods
Standardized testing frameworks rely on automated scripts that cycle legacy operating systems through virtual machine templates while logging metrics like packet loss during network passthrough and disk latency under concurrent access, and evidence from multiple studies indicates that consistent application of these scripts reveals patterns where components from the early 2000s maintain viability only within narrow ranges of allocated vRAM and virtual network adapter configurations. Observers note that July 2026 marks increased adoption of updated hypervisor releases that incorporate enhanced legacy mode flags, allowing finer control over compatibility layers without requiring full hardware refreshes across distributed sites.
Key Metrics for Threshold Mapping
- Emulation fidelity scores derived from instruction set execution traces
- Interrupt delivery timing variances measured in microseconds
- Storage controller response curves under varying queue depths
- Power state transition success rates across sleep and wake cycles
Analysts compile these metrics into visual charts that plot component age against operational stability, which helps system administrators identify safe operating envelopes before scheduling phased upgrades, and one documented case involved a manufacturing firm that mapped thresholds for decade-old PLC interfaces in a VMware environment to avoid production halts during peak output periods.
Integration Challenges Across Enterprise Setups
Legacy components often introduce cascading effects when virtualized because older drivers expect direct hardware access that modern layers abstract away through paravirtualization techniques, yet data shows successful mitigation occurs when teams apply targeted patches that bridge these gaps without altering core firmware. External validation comes from standards bodies that publish interoperability guidelines, such as those available through NIST resources on virtualization security, which detail testing sequences for maintaining operational continuity during transitions.
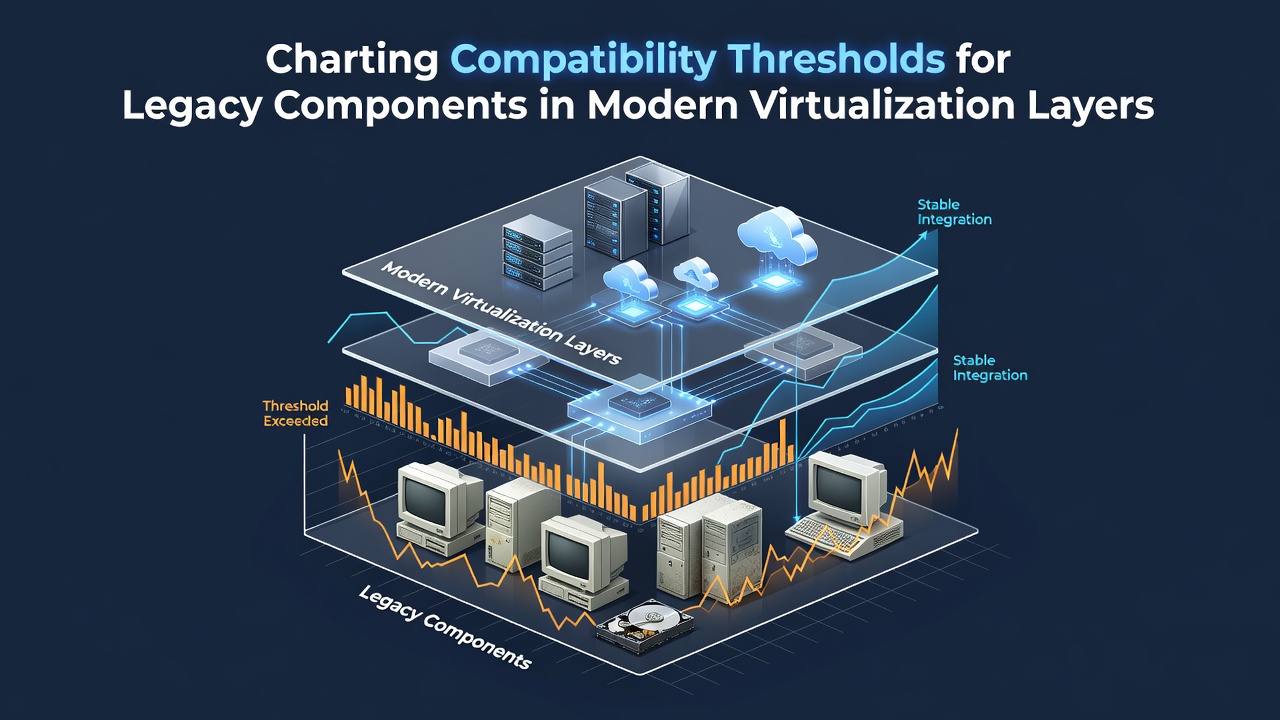
Additional insights emerge from collaborative research published by institutions across regions, including reports from Australian academic centers that examined threshold behaviors in cloud-hybrid models where satellite offices retain older peripherals connected through virtual bridges. Those findings highlight how seasonal load variations can push components past mapped limits faster than anticipated, prompting adjustments in monitoring intervals to capture early deviation signals.
Practical Applications in Current Deployments
Administrators apply threshold charts during capacity planning exercises that forecast when legacy elements will require isolation in dedicated virtual networks to prevent interference with newer workloads, and this approach has proven effective in sectors handling regulated data where downtime carries measurable costs. Figures from enterprise surveys reveal that proactive charting reduces unplanned maintenance events by aligning update schedules with documented stability windows rather than reactive troubleshooting after failures occur.
Coordination between hardware assessment cycles and virtualization rollout phases further refines these charts because real-world variables such as firmware sequencing and peripheral calibration timelines influence where thresholds actually sit, and experts have observed that cross-referencing diagnostic logs from end-user devices accelerates identification of edge cases that lab tests might overlook.
Conclusion
Systematic charting of compatibility thresholds equips organizations with actionable data for sustaining legacy components inside evolving virtualization layers, and continued refinement of testing methodologies alongside emerging hypervisor features supports smoother transitions without abrupt system replacements. This process integrates metrics from diverse sources to maintain operational resilience across mixed technology stacks.